Housing Standards 2004/2005
Financing Housing and Refurbishing Housing Estates
Lux M., P. Sunega, T. Kostelecký, D. Čermák, J. Montag
Prague: The Institute of Sociology, Academy of Sciences of the Czech Republic
4. The Effectiveness of the System of Financing Owner-Occupied Housing in the Czech Republic
4.4 Building Savings - A Quantitative Analysis
- The market in building savings in the Czech Republic shows a relatively high degree of concentration [2], which is slightly lower that the degree of concentration in the mortgage loan market and need not necessarily be a sign of inefficiency. The measure of concentration applied does not sufficiently take into account the size of the national market, and moreover, it was not possible to make a comparison with the measures of the concentration of the market in building savings in advanced countries (owing to a lack of necessary statistical data).
- In 2004 the trend of growth in the number of newly signed contracts and contracts in the savings stage in 1997 was interrupted as a result of an amendment to the law on building savings that came into effect in 2004.
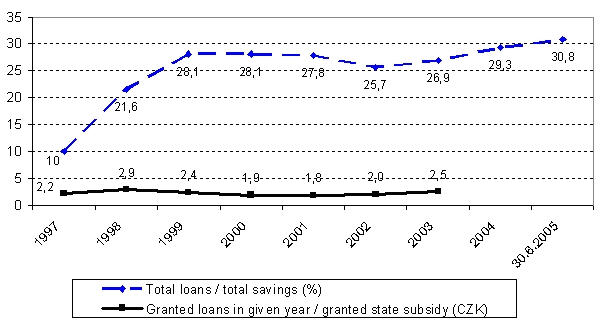
- The value of the coefficient of the loan-savings ratio (the share of the balance of clients' loan accounts to the balance of savings accounts) in the building savings sector in the Czech Republic reached 30.8% by 30 June 2005. Although from 2002 (after stagnation and a slight decline in 1999 - 2002) the value of this indicator shows an increasing tendency, it is still below the level of advanced countries (Austria, Germany), where it hovers between 70% and 80%. The reason for the low value of the loan balance indicator in the Czech Republic may be, in addition to the short period of time since the system of building savings was introduced in the Czech Republic, the too "generous" system of state support for building savings in the country, which attracts an excessively large number of clients into the system.
Graph 6: Loan activity of building savings banks

Source: Ministry of finance of the CR (http://www.mfcr.cz/cps/rde/xchg/mfcr/hs.xsl/stavebni_sporeni.html), own computations.
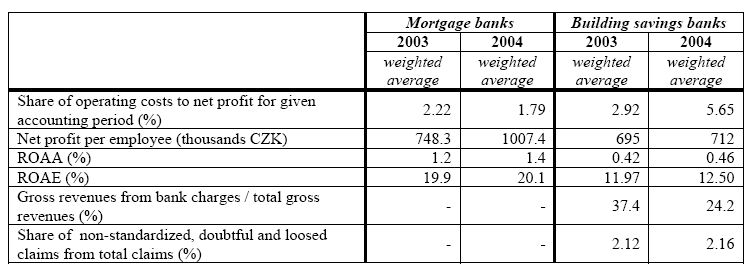
- Between 2003 and 2004 a slight improvement occurred in the sector of building savings with regard to the profitability indicator (average own capital and average assets), and net profit per employee also increased, while the share of gross yield from fees and commissions out of total gross yield decreased. Conversely, for every crown of net profit in 2004 there was a higher amount of operational costs than in 2003. The economic indicators of banks providing mortgage loans attained better values than those of the building savings banks, especially the values for the profitability of average own capital, as demonstrated in the following table.
Table 2: Selected indicators of the profitability of mortgage banks and building savings banks

Note: The weights were the amount of residential mortgage loans granted by individual banks to physical persons up to 31 December 2004.
Note: the weights were constructed according to the amount of client depositions in individual building savings banks up to 31 December 2003 (for data from 2003), or to 31 December 2004 (for data from 2004).
Source: Annual reports of mortgage banks for 2004 and annual reports for building savings banks for 2003 and 2004.
- The delinquency rate (i.e. the proportion of "bad" loans) in the building savings sector is higher than for mortgage banks. In part this is a natural phenomenon, considering the higher number of loans provided by building savings banks, their lower nominal value (and therefore greater accessibility to a broader spectrum of clients) and the fact that not all loans from building savings banks must have a security interest in real estate.
[2] The value of the Herfindahl index on 31 December 2004 was 2,251.
|