Biofotonika a optofluidika
The primary goal of the Biophotonics and Optofluidics group is to monitor, characterize, identify and describe microorganisms and the process inside of such objects. The main activities of our research group can be divided to several sections:
- Characterization of microorganisms using Raman spectroscopy and its clinical application
- Biotechnological application of Raman spectroscopy
- Combination of Raman spectroscopy and optical trapping (Raman tweezers)
- Manufacturing of microfluidiq chip and droplets generating
- Optical monitoring of biochemical reactions in optofluidic systems to optimize chemical reaction parameters
Characterization of microorganisms using Raman spectroscopy and its clinical application
The ability to identify and characterize microorganisms (bacteria, eukaryotic cells) from minute sample volumes in a rapid and reliable way is the crucial first step in the classification of microbial infections. Ideal analytical techniques would require minimal sample preparation, permit automatic analysis of many serial samples, and allow rapid classification of these samples against a stable database. Current practice, however, is far from this ideal; a typical analytical procedure might require as long as a few days. With the lack of timely laboratory results, for example, inappropriate antibiotics might be prescribed which could be ineffective against the microorganisms responsible for the infection. Not only does the patient's condition deteriorate, but the use of inappropriate drugs may well contribute to the emerging problem of drug resistance in microorganisms.
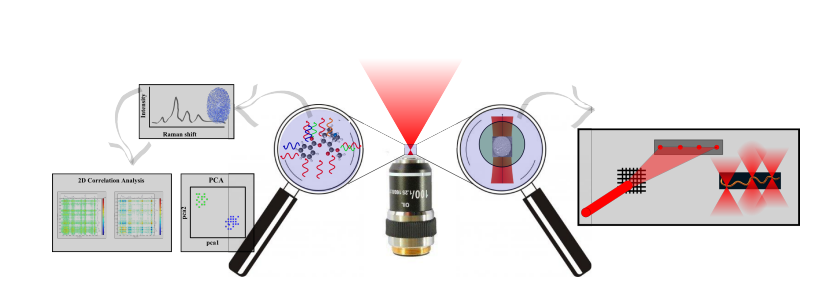
It has been shown in several studies that Raman microspectroscopy is capable of rapid identification and discrimination of biological samples including medically relevant microorganisms (bacteria, yeast). This experimental technique employs a laser beam that is focused with a microscope objective in order to excite and collect Raman scattering spectra from a small volume of the sample. A typical Raman spectrum contains a wealth of information indicative of the cellular content of nucleic acids, proteins, carbohydrates, and lipids. Such a spectrum functions as a cellular ‘fingerprint’ and serves as a sensitive indicator of the physiological state of the cell. Raman spectra thus enable to differentiate cell types, actual physiological states, nutrient conditions, and phenotype changes. In principle, Raman spectroscopy requires measurement times on the order of minutes, and sample preparation can be short and extremely economical.

Examples of Raman spectra of S. aureus (blue), S. epidermidis (orange) and their variants without carotenoids (S. aureus – yellow) and with carotenoids (S. epidermidis – violet). The spectra were vertically shifted in order to increase the visibility of details. Future Microbiology 12, 881-890, 2017
Biotechnological application of Raman spectroscopy
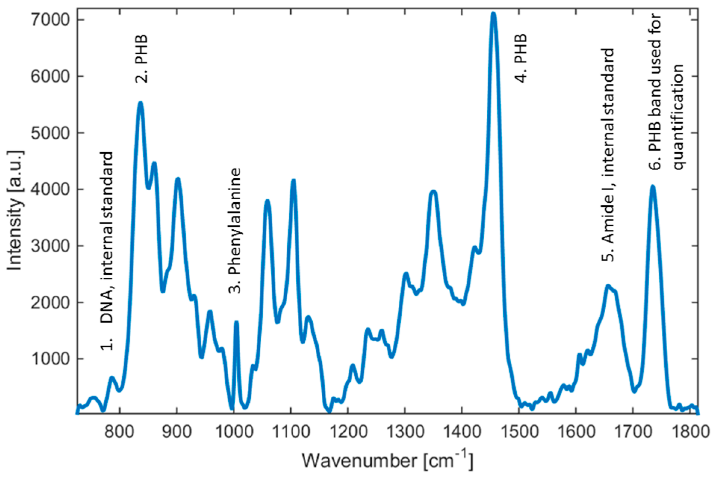
Recently, we have investigated an easy-to-apply Raman spectroscopy technique for the qualitative and quantitative determination of the amount of poly(3-hydroxybutyrate) (PHB) in bacteria Cupriavidus necator H16. The technique is applicable to near real-time and in-situ monitoring at the process control of PHB bio production. Here, Raman spectroscopy demonstrates clear benefits over existing chemical means of identification, such as gas chromatography in the speed and noninvasivity of the quantification process.

Raman spectra of Cupriavidus necator H16. Selected emission lines used in our study are highlighted. Sensors 2016, 16, 1808
Fast and reliable determination of intracellular PHB content during biotechnological production of PHB can take about 12 min. In contrast, gas chromatography analysis takes approximately 8 h.
Combination of Raman spectroscopy and optical trapping (Raman tweezers)

Since its discovery in 1928, Raman spectroscopy has passed through many instrumental revolutions, which manifests in the range of application fields of this analytical method. Nowadays, Raman spectroscopy is widely used for the identification of unknown specimens on the basis of so called fingerprint area - a spectral area of Raman spectra ranging from 400 to 2000 cm-1 which is unique for each and every biomolecule and microorganism. It seems that a combination of Raman spectroscopy and optical manipulation techniques is very advantageous; it allows 3D relocation of the investigated object using a focussed laser beam (Raman tweezers). This tool allows contactless and sterile entrapment and manipulation of mesoscopic specimen (ranging from hundreds of nm to tens of um) and, at the same time, it makes it possible to analyse the trapped object.
Manufacturing of microfluidiq chip and droplets generating
Optical monitoring of biochemical reactions in optofluidic systems to optimize chemical reaction parameters
Optofluidics, a research discipline combining optics with microfluidics, currently aspires to revolutionize the analysis of biological and chemical samples, e.g., for medicine, pharmacology, or molecular biology. In order to detect low concentrations of analytes in water, we have developed an optofluidic device containing a nanostructured substrate for surface enhanced Raman spectroscopy (SERS). The geometry of the gold surface allows localized plasmon oscillations to give rise to the SERS effect, in which the Raman spectral lines are intensified by the interaction of the plasmonic field with the electrons in the molecular bonds. The SERS substrate was enclosed in a microfluidic system, which allowed transport and precise mixing of the analyzed fluids, while preventing contamination or abrasion of the highly sensitive substrate. To illustrate its practical use, we employed the device for quantitative detection of persistent environmental pollutant 1,2,3-trichloropropane in water in submillimolar concentrations. The developed sensor allows fast and simple quantification of halogenated compounds and it will contribute towards the environmental monitoring and enzymology experiments with engineered haloalkane dehalogenase enzymes.

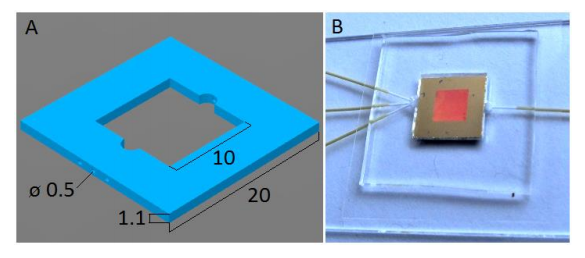
(A). Schematic image of the PDMS chip for microfluidic SERS. The chip is square shaped, with square substrate chamber in the center, with 3 inlets (left) and 1 outlet (right) for capillary tubes. Dimensions are in millimeters. (B). Photograph of the complete microfluidic chip with the SERS substrate in the microfluidic chamber on a microscope slide covered by a cover slip and the capillary tubing connected.


