Because the nuclear DNA content of G1 nucleus reflects the ploidy of a cell, estimation of DNA content is frequently used for ploidy determination.
Table 2. Relation between the ploidy and DNA content of G1 phase nuclei
| Ploidy | DNA Content (G1phase) |
| n | 1C |
| 2n | 2C |
| 4n | 4C |
Flow cytometric analysis involves the estimation of DNA content and not microscopic evaluation of chromosome number. Thus, the terms Ploidy and DNA ploidy should be used to distinguish between karyotype and DNA content analysis, respectively.
Main advantages of flow cytometric assay are:
DNA ploidy analysis using external standard
The instrument is calibrated using nuclei isolated from a plant with known ploidy, e.g. 2n (the position of the G1 peak is recorded). All other samples are characterized by the relative position of their G1 peaks. Units are thus "C-values".
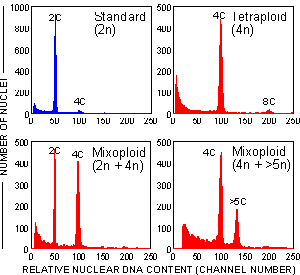
Figure 12. Histograms of relative nuclear DNA content of nuclei isolated from young leaves of Cassava plants (untreated control and plants regenerated from in vitro culture after treatment with a polyploidizing agent)
DNA ploidy analysis using internal standard
The nuclei of the standard with known ploidy and the nuclei of the sample are isolated, stained and analysed simultaneously. The DNA ploidy of the sample is then estimated using the ratio of G1 peaks (units are "C-values").
Internal standardization eliminates the risk of error due to variations in sample preparation and instrument instability. It is recommended for precise DNA ploidy estimation (especially when aneuploidy is suspected).
Research and industrial applications of flow cytometric DNA ploidy analysis include:
Screening for novel ploidy levels

Figure 13. A complete system for production of tetraploids in Musa sp. Flow cytometry is employed to screen ploidy level of plants regenerated after a treatment with polyploidizing agent in vitro. Solid tetraploids are selected at early stage of growth.
Screening for interspecific hybrids
When parental species differ enough in their nuclear DNA content, flow cytometric analysis can detect interspecific hybrids according to their intermediate DNA values. This application of flow cytometry permits screening of large numbers of progenies at early stage.

Figure 14. Identification of hybrid plants obtained after crossing Lolium multiflorum with Festuca arundinacea. Histograms of relative DNA content were obtained after analysis of nuclei isolated from leaf tissues. Chicken red blood cell nuclei (CRBC) were used as an internal reference standard.
Detection of aneuploid plants
The probability of detecting an aneuploid plant depends critically on the precision of the measure (characterized by coefficient of variation of G1 peaks) and on the difference in DNA content between aneuploid and diploid plant. Basically, there are two approaches for detection of aneuploid plants using DNA flow cytometry. In both cases, internal standards should be used.

Figure 15. If nuclei of euploid (E) and aneuploid (A) plants are analysed simultaneously, only analysis resulting in coefficient of variation (CV) lower than half of the difference between their DNA contents will allow detection of aneuploid G1 nuclei. In wheat, an average chromosome represents only 2.4% of the total DNA content. Thus a high resolution analysis resulting in CVs lower than 1.2% is needed to detect aneuploids in wheat using euploid wheat as internal standard.

Figure 16. The use of a different species as an internal standard (this approach is less sensitive to the precision of the measure). Here, an example is given for detection of aneuploids in hexaploid wheat using hexaploid triticale (T) as an internal standard. After calculating G1 peak ratios (sample/standard), the relative difference in DNA content (D) between euploid (E) and aneuploid (A) plant can be calculated:
