
Laboratory of Material Analyses II
Ústav teoretické a aplikované mechaniky › CET › About CET › Laboratories › Laboratory of Material Analysis II
Head of laboratory
Ing. Alberto Viani, Ph.D. viani@itam.cas.cz, +420 567 225 308
Research Activities
MATERIALS ANALYSIS
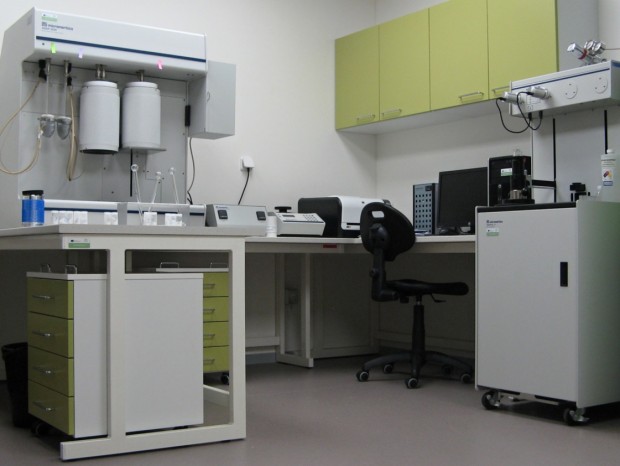
Chemical laboratory
This laboratory is dedicated to sample preparation and general chemical analysis. It is equipped with instruments for milling, chemical attack, physical characterization (e.g. pH, conductivity, sieving, weighting), titration, microwave digestion, ultrasonic bath, muffle furnace for the synthesis of compounds, etc.
X-rays diffraction (Bruker D8 Advance diffractometer - Bragg-Brentano theta-theta geometry)
Applications
This is the technique of election for investigating solid samples. It’s mainly used with samples in form of powders. Typical use is execution of qualitative analysis: phase identification in polycrystalline samples, identification of minerals in geological samples, detection of polymorphs in pharmaceutical samples, the determination of impurities in a pure phase (down to 0.1 weight %).
More advanced data treatment (Rietveld method) allows also to perform powder diffraction quantitative analysis: Quantification of phases into powdered samples, like minerals in geological samples, in raw materials, in industrial ceramics, refractories, cements, mortars. The technique is suitable for the quantification of non-crystalline component (amorphous) as well.
X-ray Crystallography: investigation of the crystal structure of known and unknown phases.
Crystallite size and residual strain: the determination of mean dimension of diffraction domains (crystallites) allows for the characterisation of samples undergoing thermal or mechanical treatments.
Texture analysis: the reconstruction of the distribution of orientation of the crystallites in polycrystalline samples, allows for the reconstruction of the sample microstructure. Specific orientation of crystallites develops as a result of industrial production processes (as for many metallic parts) or by action of external or internal agents. Examples are the way in which carbonate crystals grow in molluscs shells, the way in which crystal habit develops in rocks subjected to oriented pressure (metamorphism), the way in which crystals grow within processed technical ceramic bodies or metals.
Grazing incidence: identification of phases deposited at the surface of solid samples in form of films in the range 10-200nm, and their thickness. Typical field of application are materials for electronics, functional materials.
Peculiar to the last two methods is that they are non destructive, the sample is analysed without preparation with the aid of specific sample stages.

Typical output of Rietveld refinement of X-ray powder diffraction data. On the lower half of the picture, the original spectrum (in blue) and the refined one (in red) together with the difference between the experimental and the calculated (gray line) and markers corresponding to reflection peaks of the phases in the sample, are depicted. Quantification of all the phases including the amorphous (non crystalline) fraction is reported on the bottom right.
Scanning electron microscopy (SEM FEI Quanta 450 FEG )
Although the best results are obtained with a superficial conductive coating of few nanometers (usually gold or carbon), it’s possible to characterize even non-conductive samples, avoiding any treatment. Working under low vacuum and ESEM enables charge-free imaging and analysis of non-conductive and/or hydrated specimens.
Applications
NanoCharacterization: Metals & alloys, oxidation/corrosion, fractures, failure analysis, welds, polished sections, magnetic and superconducting materials. e.g. ceramics, composites, plastics, films/coatings, geological sections, minerals, soft materials (polymers, pharmaceuticals, filters, gels, tissues, plant material), particles, porous materials, cements, fibers.
In situ NanoProcesses: hydration/dehydration; wetting behaviour/contact angle analysis; oxidation/corrosion; tensile (with heat or cooling); crystallization/phase transformation.
The EDS detector allows for investigating the chemical composition with high spatial resolution.
The EBSD detector, allows for accomplishing micro-diffraction on the specimen’s surface, thus, identify the nature of crystalline phases within the sample and perform texture analysis: the reconstruction of the distribution of orientation of the crystallites in polycrystalline samples, allows for the reconstruction of the sample microstructure. Specific orientation of crystallites develops as a result of industrial production processes (as for many metallic parts) or by action of external or internal agents. Examples are the way in which carbonate crystals grow in molluscs shells, the way in which crystal habit develops in rocks subjected to oriented pressure (metamorphism), the way in which crystals grow within processed technical ceramic bodies or metals.

Examples from our SEM investigations: top left: spherical particle in fly ashes from combustion of coal; top right: detail of crack failure in steel; bottom left: glass fibres in fibre cement composite construction material; bottom right: EBSD pattern of silicon wafer.
Chemical analysis (ICP - OES Spectroblue)
Applications
ICP-OES is a widely used analytical technique for the determination of major and trace elements. The ICP-OES technique has been applied to the analysis of a large variety of agricultural and food materials, like trace metals in beer and wine; trace elements in biological systems.
Geological applications of ICP-OES involve determinations of major, minor and trace compositions of various rocks, soils, sediments, and related materials.
Environmental analysis, analysis of drinking and waste water, soils, sludge, plants, foods.
ICP-OES is used widely for the determination of major, minor and trace elemental constituents in metals and related materials.
Analysis of organic solutions by ICP-OES is important not only for analysing organic-based materials such as petroleum products but also for a wide variety of other applications. lubricating oils for trace metal content is one of the more popular applications for organics analysis by ICP-OES. Some other applications include determination of lead in gasoline; determination of Cu, Fe, Ni, P, Si and V in cooking oils; analysis of organophosphates for trace contaminants; and determination of major and trace elements in antifreeze.
Chemical analysis (IEC (Ion Exchange Chromatography) DIONEX)
Applications
Ion chromatography system is designed to perform analysis of specific anions and cations in liquid samples. Common applications are: qualitative and quantitative determination of water soluble salts from a wide range of solid samples, such as bricks, mortars, cements and chemical analysis of water samples.

The figure reports a spectrum obtained using point measurement mode on the elongated crystal depicted in the inset picture. Peaks correspond to Raman bands of aragonite (CaCO3).
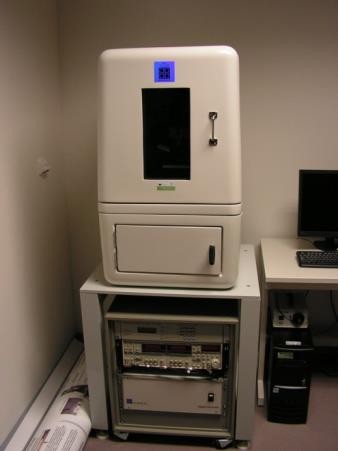
Micro Raman spectroscopy (DXR microscope)
Applications
This spectroscopic technique allows for identification of specific compounds within a wide range of specimens, organic and inorganic. With the aid of the optical microscope the laser beam can be focused down to 0,6 µm, thus, onto very small particles. Typical applications include: identification of particulate contaminants, high-resolution depth profiling and subsurface analysis on transparent and semi opaque samples, characterization of coatings, multi-layer laminates, thin films, inclusions and subsurface defects.
Good representation of carbon and silicon molecular backbones provides great differentiation of pharmaceutical and mineral polymorphs as well as differentiation of amorphous and crystalline forms of silicon and different carbon nanomaterials.
Surface areas and subsurfaces can be investigated producing x-y area maps and x-z maps. Measurements can be accomplished through glass and plastic packaging.
Infrared spectroscopy (Nicolet iN10 microscope)
Applications
This spectroscopic technique allows for identification of specific compounds within a wide range of specimens, organic and inorganic. Measurements can be performed in transmission mode (producing a small pellet containing few mg of powder sample) or in reflection mode (in which the sample surface is simply investigated). Typical applications include: microspectroscopy with identification of compounds and contaminants inside the sample, particle analysis, study of inclusions, investigation of packaging and laminate, coatings, failure analysis. Maps with compound distribution can be produced.
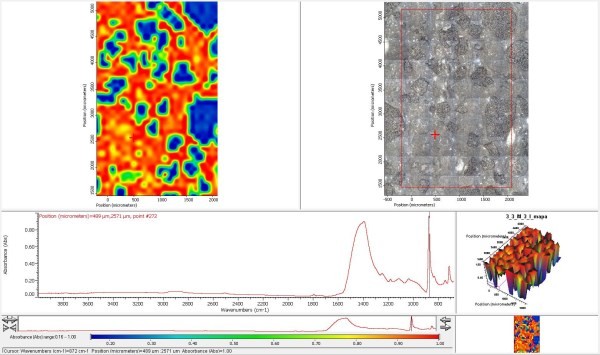
Example of outputs of FT-IR using Micro ATR technique. The chemical map (on the left) show the distribution of calcite (red areas with high concentration of calcite (CaCO3), blue area without calcite) in the selected area of the sample depicted on the right. On the bottom left a typical spectrum showing peaks of calcite is reported.
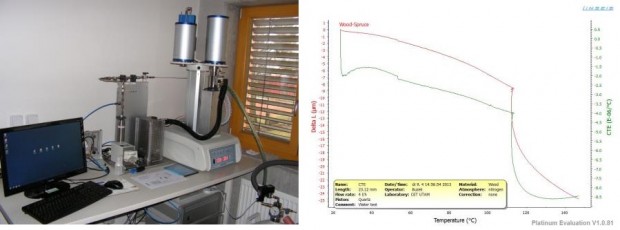
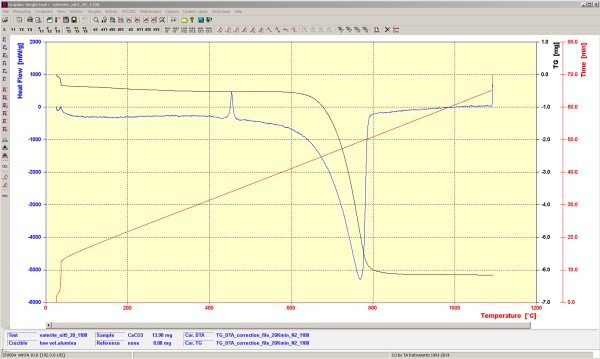
Thermal Analysis (STA 504)
The method is based on the measurement of changes in mass (TG) and heat flow (DTA) simultaneously, as function of temperature. This can be accomplished in the temperature range -160 – 700°C or from room temperature to 1100°C.
Applications
Typical applications include: identification of compounds following their thermal decomposition/transformation with temperature (e.g. phases of hydration in mortars and concrete), and their quantification; determination of decomposition temperatures, glass transition temperature in polymers, calculation of specific heat capacity. Engine oil volatility measurements, filler content, flammability studies, measurement of volatiles (e.g. water, oil), oxidative stabilities, thermal stabilities, catalyst and coking studies, melting/crystallization behavior. The technique is particularly suitable for the analysis of construction, ceramic and geological materials.
POROSIMETRY
Laboratory dedicated to the investigation of the structure of porous materials , identifying physical characteristics and behavior of materials, particularly materials of historic structures.
Mercury porosimeter (Autopore IV 9500)
Characterizes a material’s porosity by applying various levels of pressure to a sample immersed in mercury.
Range: pore diameter 5nm - 360 micron
Helium pycnometry (AccuPyc II 1340)
Standard method for the determination of the so-called skeletal density (density of the material excluding voids)
Sample size of 0,01 to 350 cubic centimeters
Specific surface area (Asap 2020)
Determination of surface area, also known as BET surface area and distribution of pore size in solid materials.
SAMPLE PREPARATION
Equipped with modern intruments for cutting, grinding, polishing of samples and preparation of polished and thin sections.
MICROSCOPY
Petrographic polarizing microscope operated in transmitted and reflected light
Applications
Description of the components of the material, texture, size,shape, distribution of individual components, mineralogical composition
Videomicroscopes Hirox KH 7700 with transmitted and reflected light
Digital microscope for observation with a large depth of field when placed on a tripod or hand-held
Applications
Morphology of untreated surfaces
Petrographic analyzes of the through - polarized light
Stereo Microscope SZX -7
Microscope designed for materials science with magnification up to 120x