| Total number | 404 |
| Recalculated number | 319 |
Education structure of employees
| Basic education | 1% |
| Lower secondary education | 1% |
| Secondary vocational education | 4% |
| Full secondary general education | 3% |
| Full secondary vocational education with apprenticeship and school leaving exam | 2% |
| Full secondary vocational education with school leaving exam | 14% |
| Bachelor degree | 5% |
| University degree | 31% |
| Doctor degree | 39% |
Number of appointed scientific-pedagogical degrees
|
13 | |
| Associate professor | 18 | |
| DSc., DrSc. | 25 |
|
| Emeritus | 10 |
Age structure of employees
| up to 25 years | 9% |
| 26-30 years | 22% |
| 31-40 years | 24% |
| 41-50 years | 19% |
| 51-60 years | 14% |
| above 61 years | 12% |
Professional category structure of employees
| postdoctoral fellow | 27 |
| scientific assistant | 44 |
| junior scientist | 40 |
| senior scientist | 34 |
| other scientific staff (university deg.) | 54 |
| doctorand | 83 |
| other professional staff (university deg.) | 5 |
| other professional staff (secondary deg.) | 48 |
| technical and economic staff | 37 |
| worker | 32 |
Foreigners structure of employees
| Slovakia | 28 |
| India | 7 |
| Ukraine | 6 |
| Italy | 5 |
| Serbia | 5 |
| Spain | 3 |
| Russia | 2 |
| Belarus | 1 |
| Brazil | 1 |
| Bulgaria | 1 |
| France | 1 |
| Georgia | 1 |
| Chile | 1 |
| Poland | 1 |
| Zambie | 1 |
Data from 30.3. 2020.

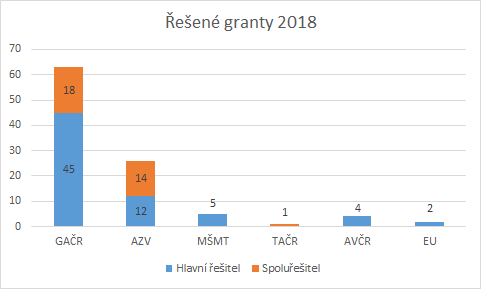
| The success of grant projects | AZV/IGA | GAČR |
| 2013 | 62,5% | 28,6% |
| 2014 | 23,7% | |
| 2015 | 45,8% | 30,6% |
| 2016 | 40,0% | 40,7% |
| 2017 | 33,3% | 44,7% |
| 2018 | 38,5% | 30,4% |
| 2019 | 25,0% | 30,6% |
| 2020 | 42,8% | 27,4% |
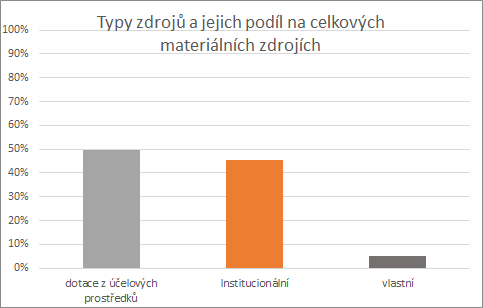
Material funds
